Not long ago, I was contacted by a journalist at The Mill, who, along with many other curious Mancunians, had taken an interest in a particular “X, formerly Twitter” post of mine. It used ONS (Office for National Statistics) data to show just how stark Manchester’s demographic split really is — where the ‘white collar’ workers live, and where ‘blue collar’ workers dwell in turn.
I’ll be honest: I didn’t expect a data nerd’s map to gain the traction it did. It was a simple concept — a map of Greater Manchester and its surroundings with each “centroid” (geolocated population data) overlaid on top, colour-coded for clarity. The blue and red colours represent what the ONS calls “social grade”, essentially a proxy for class:
Deep blue = AB: higher and intermediate managerial or professional role
Light blue = C1: supervisory, clerical, and junior managerial role
Light Red = C2: skilled manual occupations
And so on.
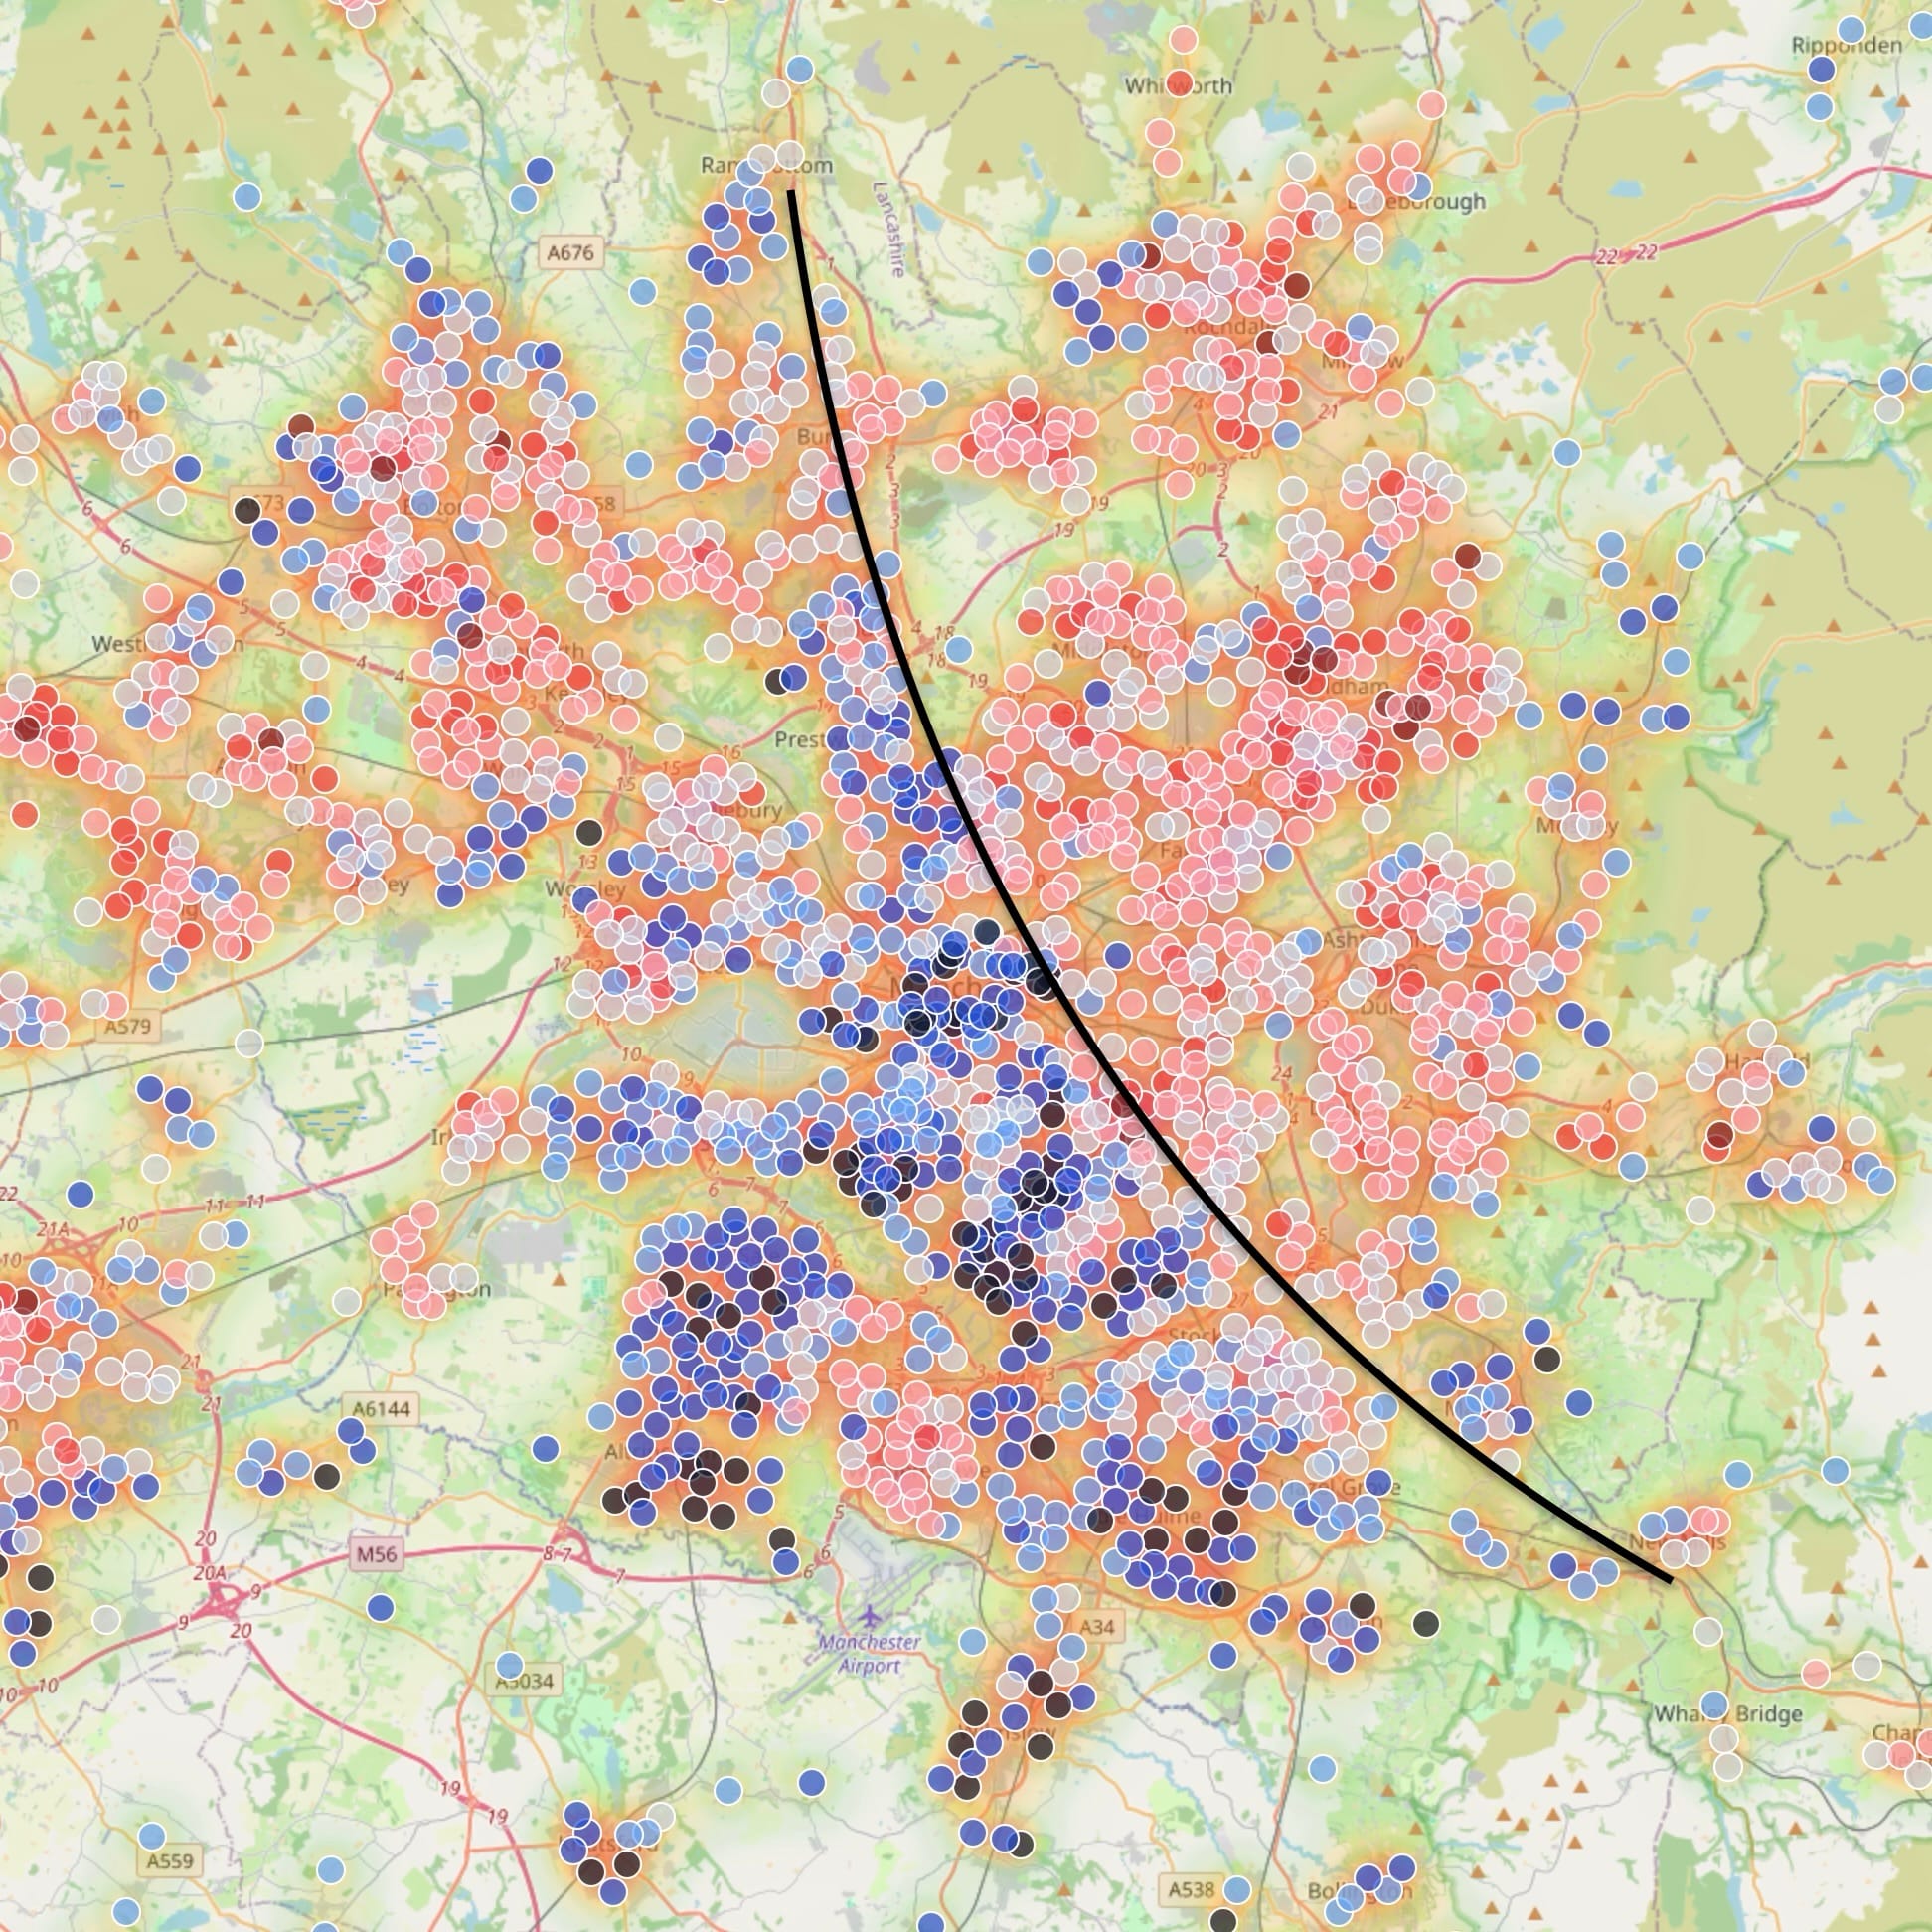
From the response it received on X, it seems we Mancs still have visceral reactions to seeing blue on one side and red on the other, especially when they’re the wrong way round (because, and hopefully this doesn’t spark yet another online debate, we all know west is red and east is blue).
But of course the most surprising part of the map is the direction of the divide. Shouldn’t the split be north/south? Historically and culturally, that’s the image most of us have in our heads when it comes to Greater Manchester. The north and south have always felt like very different places. The south is all leafy suburbs – Chorlton, Didsbury, Altrincham, Cheadle – full of parks, where Gail’s bakeries rule supreme and everyone has the time to read on their commute to their difficult-to-explain city centre job. Meanwhile the north is finally shedding its flatcap wearing, mill working days (though I’d like to believe Fred Dibnah personally took care of the last chimney) only to enter an era of vape shops, bagel cafes, and crowded buses.
This, of course, is mostly nonsense, a stereotype that’s easier than the more nuanced truth. The reality differs in two key ways. Firstly, they have Gail’s north of Manchester too (need I mention the Prestwich controversy?) and, secondly, as the map shows, the labour divide actually appears to run east/west as opposed to north/south (well, southwest to northeast if we’re being picky).
So why is this? How did the east/west divide come to be — and why has it hung on to this day? There are a number of fascinating geographical and historical quirks that help explain this split, involving mills, roads, trams, and a less expected but most crucial factor: the wind.
This article is for paying members only
Join The Mill for full access to this story, plus four great features delivered to your inbox every week — and the knowledge that you're supporting a new model of local news that puts quality and honesty first.
From £8.95/month · cancel anytime
Get full accessAlready have an account? Sign In